Necessity of lightning surge protection Explanation of the increase in lightning damage

Technical information

Necessity of lightning surge protection

World Lightning Map

Lightning is not uniformly distributed across the Earth.
Article by: Hobart M. King, PhD, RPG

World Lightning Map : The map above shows the average yearly counts of lightning flashes per square kilometer based on data collected by NASA’s Lightning Imaging Sensor on the Tropical Rainfall Measuring Mission satellite between 1995 and 2002. Places where less than one flash occurred (on average) each year are gray or light purple. The places with the largest number of lightning strikes are deep red, grading to black.

Annual damage estimated at 200 billion yen

Total damage increases year by year

The total amount of annual lightning damage in Japan is estimated to be between 100 billion yen and 200 billion yen (IEEJ Technical Report No. 902, 2002, JLPA survey). 200 billion yen is a figure that includes not only damage to factory machinery caused by lightning strikes, but also secondary damage such as the shutdown of operations. In some cases in the past, a single lightning strike has caused damage worth tens of millions of yen.
The graph below shows the amount of mutual aid payments made by the National Association of Local Authorities in Japan due to lightning damage, and if 2009 is taken as 1, the amount paid in 2013 was 1.63 times greater. This amount accounts for 50% of all mutual aid payments.

Japan ranks worst in climate risk index

Worst among 183 countries in the world, based on deaths, economic losses, etc.

According to the Global Climate Risk Index (2020 edition), Japan ranks first among 183 countries in the world in terms of the number of deaths and economic losses due to the heavy rains in July 2006, which caused extensive damage. The Global Climate Risk Index (2020), a report that ranks the impact of weather disasters such as typhoons and floods, is published annually by German watch, a German NGO, and this is the 15th edition. The Climate Risk Index (CRI) is compiled.
The Climate Risk Index (CRI) ranks countries and regions according to the following criteria: (1) number of fatalities, (2) number of fatalities per 100,000 population, (3) economic losses, and (4) economic losses as a percentage of GDP. The lower the CRI, the greater the impact of weather-related disasters.

Weather-related economic losses are on the rise worldwide.

In Japan, the threat of typhoons, including lightning, is increasing.

From 2010 to 2019, weather-related economic losses worldwide averaged $161.8 billion (about 17 trillion yen), up 60% from the previous decade (according to a study by an institute affiliated with Swiss Re, a major reinsurance company).
In Japan alone, the threat of typhoons, including lightning, has been increasing in recent years.

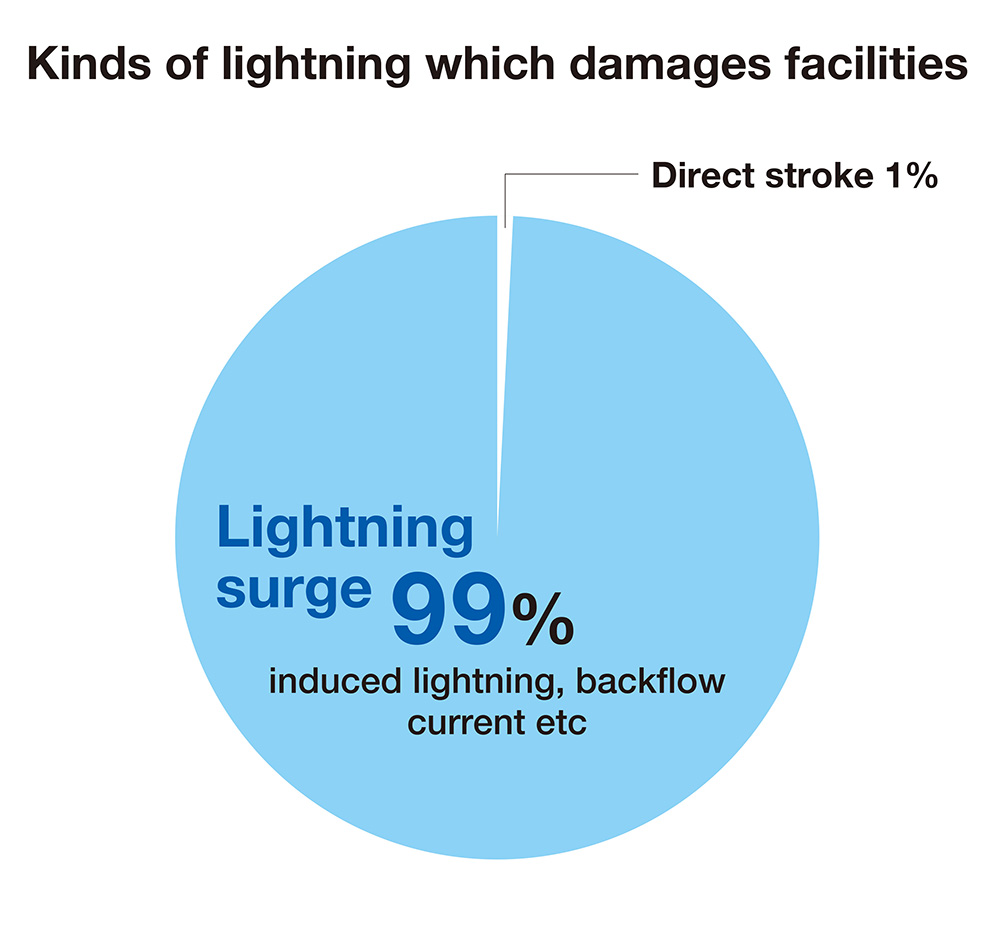
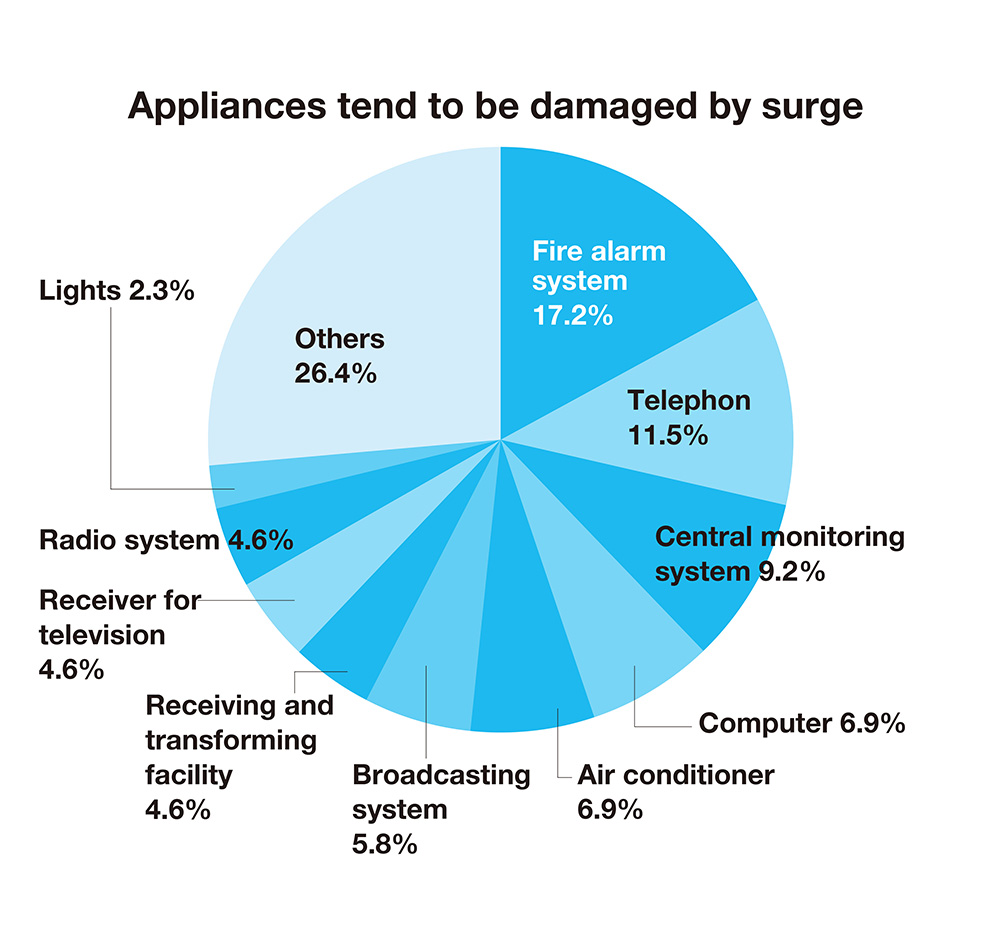
99% of lightning damage is caused by “lightning surges
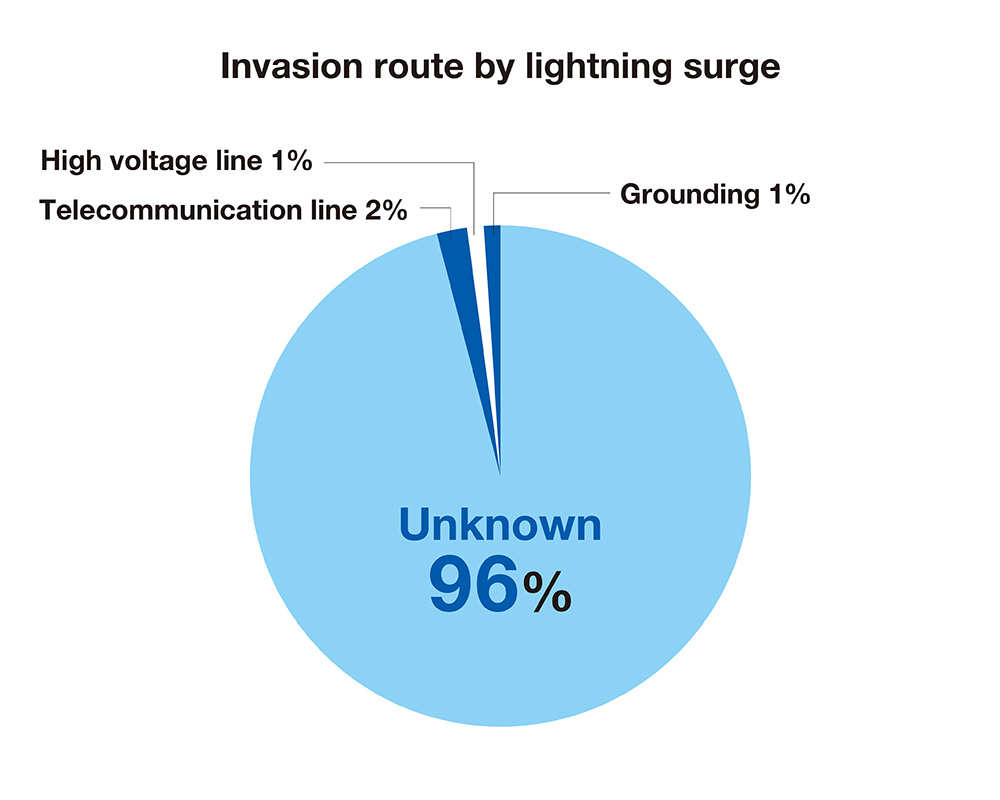
And the route of entry for most of them is unknown.

We tend to think of lightning damage as a direct strike, but only 1% of lightning damage is caused by a direct strike. Most lightning damage is caused by “lightning surge” (induced lightning, backflow lightning, etc.). The need for lightning surge protection has increased in recent years.

Lightning surge affects a variety of equipment

Lightning surge affects equipment with long wiring, such as automatic fire alarm systems, telephone equipment, and monitoring cameras.

Because the route of entry is unknown, an investigation by a specialist is necessary

In many cases, it is unclear where the lightning surge entered from, and the damage is often indistinguishable from a general malfunction. Therefore, when implementing lightning countermeasures, diagnosis by a specialist is essential. It is important to have a lightning expert conduct an on-site investigation to determine if the equipment failure is caused by lightning surge, and if lightning surge is the cause, to determine the lightning surge entry route and take countermeasures.

Why the rapid increase in lightning damage?
The cause is the high integration and networking of devices

As energy conservation and the density of electrical components increase, products that operate at small voltages are more susceptible to lightning surges. In addition, with the development of ICT, various devices are connected by networks, and the path of lightning surge penetration is expanding.

The above figure shows the evolution of IC chips. 1975’s circuit boards had thicker wires and more distance between the wires, so insulation was maintained. Not only IC chips, but also the entire board is becoming more vulnerable to lightning surges due to energy saving and higher density.